Up to 18% of the world’s electricity could be generated with wind energy by 2050, but the massive jump from 2.6% today would require the nearly 300 GW of current wind capacity worldwide to increase eight- to tenfold and cost nearly $150 billion a year, the International Energy Agency (IEA) said in an updated assessment of the world’s wind power.
The Paris-based autonomous energy agency now sees a much larger penetration of wind power than the 12% by 2050 share forecast in its previous 2009 edition of the “Technology Roadmap: Wind Energy.” Forecasts put China as the world’s future wind power leader, overtaking European members of the Organisation for Economic Co-operation and Development by about 2020 or 2025, with the U.S. ranked third.
But IEA Executive Director Maria van der Hoeven cautioned that much more remains to be done before that increased share of wind is achieved, so that a global energy-related carbon dioxide target of 50% below current levels can be reached by 2050. “There is a continuing need for improved technology,” she said. “Increasing levels of low-cost wind still require predictable, supportive regulatory environments, and appropriate market designs. The challenges of integrating higher levels of variable wind power into the grid must be tackled. And for offshore wind—still at the early stages of the deployment journey—much remains to be done to develop appropriate large-scale systems and to reduce costs.”
Since 2008, the report notes, wind power deployment has more than doubled on the back of technological developments that have boosted energy yields and reduced operation and maintenance costs. Today, wind power provides 30% of Denmark’s total generation, 20% of Portugal’s, and 18% of Spain’s. The report finds that wind power has only received 2% of the world’s public energy research and development funding. Yet, costs have fallen: Land-based wind power generation costs range from $60/MWh to $130/MWh at most sites, and it can be competitive “where wind resources and financing conditions are favorable,” the IEA says, but “it still requires support in most countries.”
Trends in the world’s wind sector noted by the agency include the large-scale deployment of offshore wind farms (though the IEA points out this is limited mostly to Europe), an increasing number of turbines being installed in cold climates, and a rise in repowering old wind turbines with more modern and productive equipment.
Repowering in particular is slated to grow tremendously over the next five years, increasing power generation at repowered sites from 1.5 TWh to 8.2 TWh by 2020.
Wind market shares have also seen dramatic changes over the last five years, though most wind turbine manufacturers are concentrated in six countries: the U.S., Denmark, Germany, Spain, India, and China. China’s six largest wind companies alone have exceeded the majority 20% market share in recent years.
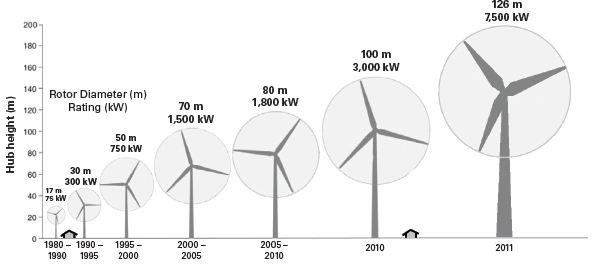
Technologically, a general trend in turbine design has been to increase the height of the tower and the length of the blades. “This decrease in the specific power, or ratio of capacity over swept area, has pushed up capacity factors considerably for the same wind speeds,” says the IEA. The average rated capacity of land-based wind turbines has also increased from 1.6 MW in 2008 to 1.8 MW in 2012, while for offshore turbines, it has grown to 4 MW in 2012, versus 3 MW in 2008 (Figure 3). Otherwise, the sector is also seeing more development of rotors designed for lower wind speeds. Focus is also being placed on grid compatibility, acoustic emissions, visual appearance, and suitability for site conditions.

Growing giants. According to the International Energy Agency, the size of wind turbines has continued to increase. The average rated capacity of new grid-connected onshore turbines in 2012 was 1.8 MW, compared to 1.6 MW in 2008, though the largest commercial wind turbine available today is 7.5 MW, with a rotor diameter of 127 meters. Offshore turbine sizes have grown from 3 MW to 4 MW in 2012. However, turbines with a rated capacity ranging from 1.5 MW to 2.5 MW still make up the largest market segment.
- CBCSD and Members Participated and Suggested on the Project for Technical Regulation on Low-carbon Pilot Community
- CBCSD and Members Participated in the APEC Cooperation Network Construction Forum of Green Supply Chain
- Calculation Method of CO2 Emissions in Petroleum and Natural Gas Exploitation Enterprises & Calculation Method of CO2 Emissions in Water Network of Chemical Enterprises
- CBCSD Attended the Workshop for Environmental Protection and Sustainable Development and Delivered Introductions
- WBCSD: Tackling the Challenge, How to Make Informed Choices on Forest Product?
- The National New-Type Urbanization Plan Released, Board Members of CBCSD Help the Sustainable Development of Cities
- Board members of CBCSD Actively Participated in the Carbon Trading and International Climate Change Process
- Two industrial Standards Compiled by CBCSD Passed Examination
- Widespread Use of the Achievements Businesses Energy Saving and Greenhouse Gas Management
- CBCSD held Chemical industry enterprise value chain (range 3) greenhouse gas emissions, accounting and reporting guidelines


